Looking at dataframes in R
Dataframes are the fundamental data structure in R. They are essentially tables consisting of variables and observations. If you can represent your dataset as a dataframe, you're ready to start answering questions about it using the power of R. Let's take a look at a dataframe.
Load the mpg dataframe contained in the tidyverse package:
library(tidyverse)
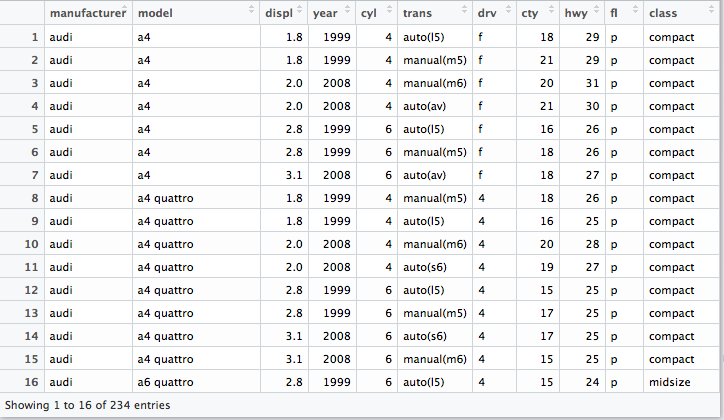
mpg
## # A tibble: 234 x 11
##    manufacturer      model displ  year   cyl      trans   drv   cty   hwy
##           <chr>      <chr> <dbl> <int> <int>      <chr> <chr> <int> <int>
##  1         audi         a4   1.8  1999     4   auto(l5)     f    18    29
##  2         audi         a4   1.8  1999     4 manual(m5)     f    21    29
##  3         audi         a4   2.0  2008     4 manual(m6)     f    20    31
##  4         audi         a4   2.0  2008     4   auto(av)     f    21    30
##  5         audi         a4   2.8  1999     6   auto(l5)     f    16    26
##  6         audi         a4   2.8  1999     6 manual(m5)     f    18    26
##  7         audi         a4   3.1  2008     6   auto(av)     f    18    27
##  8         audi a4 quattro   1.8  1999     4 manual(m5)     4    18    26
##  9         audi a4 quattro   1.8  1999     4   auto(l5)     4    16    25
## 10         audi a4 quattro   2.0  2008     4 manual(m6)     4    20    28
## # ... with 224 more rows, and 2 more variables: fl <chr>, class <chr>
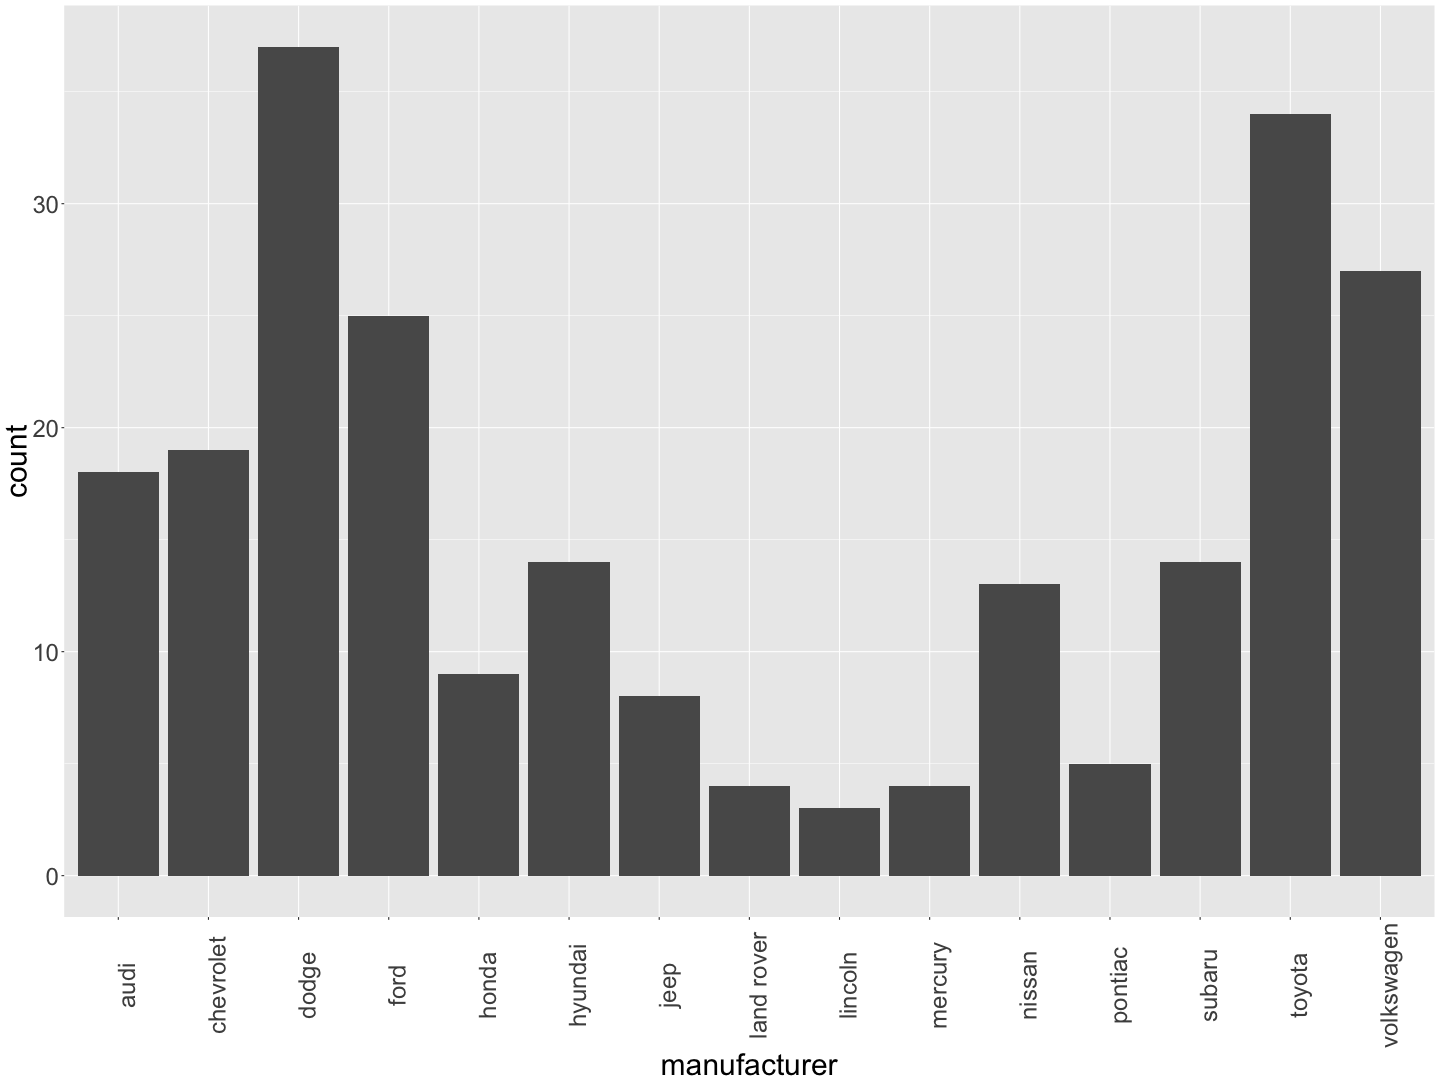
Look at all that data! This dataframe contains data about the fuel economy of cars, collected between 1999 and 2008. Specifically, it's a table containing 234 rows, and 11 columns. It's called a "tibble", which is just a slightly modernised version of R's original data.frame. We'll come back to the mpg dataset in Subjects and Variables.
You can create your own tibbles:
mytibble <- tibble(
  x = 1:4,
  y = x^2,
  z = y + 0.1
)
mytibble
## # A tibble: 4 x 3
##       x     y     z
##   <int> <dbl> <dbl>
## 1     1     1   1.1
## 2     2     4   4.1
## 3     3     9   9.1
## 4     4    16  16.1
And also create "tribbles": not the troublesome kind of Tribbles, but "transposed tibbles":
mytribble <- tribble(
  ~x, ~y, ~z,
  1, 4.2,"a",
  3, 9.6,"b",
  4,16.8,"c"
)
mytribble
## # A tibble: 3 x 3
##       x     y     z
##   <dbl> <dbl> <chr>
## 1     1   4.2     a
## 2     3   9.6     b
## 3     4  16.8     c
...which might be easier, depending on your situation.
Great! So, if you have done what I have been showing you here, you should now be able to load dataframes, and even build your own dataframes!
Getting variables from a dataframe
You might want to look at only part of a dataframe. For example, I noticed the names of a number of models of cars in the mpg dataset, so let's focus in on them. You can select a single column using the $ symbol:
mpg$model
##   [1] "a4"                     "a4"
##   [3] "a4"                     "a4"
##   [5] "a4"                     "a4"
##   [7] "a4"                     "a4 quattro"
##   [9] "a4 quattro"             "a4 quattro"
##  [11] "a4 quattro"             "a4 quattro"
##  [13] "a4 quattro"             "a4 quattro"
##  [15] "a4 quattro"             "a6 quattro"
##  [17] "a6 quattro"             "a6 quattro"
##  [19] "c1500 suburban 2wd"     "c1500 suburban 2wd"
##  [21] "c1500 suburban 2wd"     "c1500 suburban 2wd"
##  [23] "c1500 suburban 2wd"     "corvette"
##  [25] "corvette"               "corvette"
##  [27] "corvette"               "corvette"
##  [29] "k1500 tahoe 4wd"        "k1500 tahoe 4wd"
##  [31] "k1500 tahoe 4wd"        "k1500 tahoe 4wd"
##  [33] "malibu"                 "malibu"
##  [35] "malibu"                 "malibu"
##  [37] "malibu"                 "caravan 2wd"
##  [39] "caravan 2wd"            "caravan 2wd"
##  [41] "caravan 2wd"            "caravan 2wd"
##  [43] "caravan 2wd"            "caravan 2wd"
##  [45] "caravan 2wd"            "caravan 2wd"
##  [47] "caravan 2wd"            "caravan 2wd"
##  [49] "dakota pickup 4wd"      "dakota pickup 4wd"
##  [51] "dakota pickup 4wd"      "dakota pickup 4wd"
##  [53] "dakota pickup 4wd"      "dakota pickup 4wd"
##  [55] "dakota pickup 4wd"      "dakota pickup 4wd"
##  [57] "dakota pickup 4wd"      "durango 4wd"
##  [59] "durango 4wd"            "durango 4wd"
##  [61] "durango 4wd"            "durango 4wd"
##  [63] "durango 4wd"            "durango 4wd"
##  [65] "ram 1500 pickup 4wd"    "ram 1500 pickup 4wd"
##  [67] "ram 1500 pickup 4wd"    "ram 1500 pickup 4wd"
##  [69] "ram 1500 pickup 4wd"    "ram 1500 pickup 4wd"
##  [71] "ram 1500 pickup 4wd"    "ram 1500 pickup 4wd"
##  [73] "ram 1500 pickup 4wd"    "ram 1500 pickup 4wd"
##  [75] "expedition 2wd"         "expedition 2wd"
##  [77] "expedition 2wd"         "explorer 4wd"
##  [79] "explorer 4wd"           "explorer 4wd"
##  [81] "explorer 4wd"           "explorer 4wd"
##  [83] "explorer 4wd"           "f150 pickup 4wd"
##  [85] "f150 pickup 4wd"        "f150 pickup 4wd"
##  [87] "f150 pickup 4wd"        "f150 pickup 4wd"
##  [89] "f150 pickup 4wd"        "f150 pickup 4wd"
##  [91] "mustang"                "mustang"
##  [93] "mustang"                "mustang"
##  [95] "mustang"                "mustang"
##  [97] "mustang"                "mustang"
##  [99] "mustang"                "civic"
## [101] "civic"                  "civic"
## [103] "civic"                  "civic"
## [105] "civic"                  "civic"
## [107] "civic"                  "civic"
## [109] "sonata"                 "sonata"
## [111] "sonata"                 "sonata"
## [113] "sonata"                 "sonata"
## [115] "sonata"                 "tiburon"
## [117] "tiburon"                "tiburon"
## [119] "tiburon"                "tiburon"
## [121] "tiburon"                "tiburon"
## [123] "grand cherokee 4wd"     "grand cherokee 4wd"
## [125] "grand cherokee 4wd"     "grand cherokee 4wd"
## [127] "grand cherokee 4wd"     "grand cherokee 4wd"
## [129] "grand cherokee 4wd"     "grand cherokee 4wd"
## [131] "range rover"            "range rover"
## [133] "range rover"            "range rover"
## [135] "navigator 2wd"          "navigator 2wd"
## [137] "navigator 2wd"          "mountaineer 4wd"
## [139] "mountaineer 4wd"        "mountaineer 4wd"
## [141] "mountaineer 4wd"        "altima"
## [143] "altima"                 "altima"
## [145] "altima"                 "altima"
## [147] "altima"                 "maxima"
## [149] "maxima"                 "maxima"
## [151] "pathfinder 4wd"         "pathfinder 4wd"
## [153] "pathfinder 4wd"         "pathfinder 4wd"
## [155] "grand prix"             "grand prix"
## [157] "grand prix"             "grand prix"
## [159] "grand prix"             "forester awd"
## [161] "forester awd"           "forester awd"
## [163] "forester awd"           "forester awd"
## [165] "forester awd"           "impreza awd"
## [167] "impreza awd"            "impreza awd"
## [169] "impreza awd"            "impreza awd"
## [171] "impreza awd"            "impreza awd"
## [173] "impreza awd"            "4runner 4wd"
## [175] "4runner 4wd"            "4runner 4wd"
## [177] "4runner 4wd"            "4runner 4wd"
## [179] "4runner 4wd"            "camry"
## [181] "camry"                  "camry"
## [183] "camry"                  "camry"
## [185] "camry"                  "camry"
## [187] "camry solara"           "camry solara"
## [189] "camry solara"           "camry solara"
## [191] "camry solara"           "camry solara"
## [193] "camry solara"           "corolla"
## [195] "corolla"                "corolla"
## [197] "corolla"                "corolla"
## [199] "land cruiser wagon 4wd" "land cruiser wagon 4wd"
## [201] "toyota tacoma 4wd"      "toyota tacoma 4wd"
## [203] "toyota tacoma 4wd"      "toyota tacoma 4wd"
## [205] "toyota tacoma 4wd"      "toyota tacoma 4wd"
## [207] "toyota tacoma 4wd"      "gti"
## [209] "gti"                    "gti"
## [211] "gti"                    "gti"
## [213] "jetta"                  "jetta"
## [215] "jetta"                  "jetta"
## [217] "jetta"                  "jetta"
## [219] "jetta"                  "jetta"
## [221] "jetta"                  "new beetle"
## [223] "new beetle"             "new beetle"
## [225] "new beetle"             "new beetle"
## [227] "new beetle"             "passat"
## [229] "passat"                 "passat"
## [231] "passat"                 "passat"
## [233] "passat"                 "passat"
Do you notice how when you type mpg$, a list of the column names pops up? You can navigate this list using the arrow keys, or even start typing part of a column name to search the list. For example, as the model column is the only column of mpg containing an "o", I could have typed mpg$, then o, then hit enter, and ended up with the same as above. Neat!
Note: You can get the same result as above by typing mpg[['model']], but you don't get the auto-complete in RStudio compared to the first version.
Anyway, that was a lot of car model names (234 to be precise - the same as the number of rows of the dataframe). What if we want to see how many different types of car there are in the dataset? Let's try putting the word unique in front of our previous command...
unique(mpg$model)
##  [1] "a4"                     "a4 quattro"
##  [3] "a6 quattro"             "c1500 suburban 2wd"
##  [5] "corvette"               "k1500 tahoe 4wd"
##  [7] "malibu"                 "caravan 2wd"
##  [9] "dakota pickup 4wd"      "durango 4wd"
## [11] "ram 1500 pickup 4wd"    "expedition 2wd"
## [13] "explorer 4wd"           "f150 pickup 4wd"
## [15] "mustang"                "civic"
## [17] "sonata"                 "tiburon"
## [19] "grand cherokee 4wd"     "range rover"
## [21] "navigator 2wd"          "mountaineer 4wd"
## [23] "altima"                 "maxima"
## [25] "pathfinder 4wd"         "grand prix"
## [27] "forester awd"           "impreza awd"
## [29] "4runner 4wd"            "camry"
## [31] "camry solara"           "corolla"
## [33] "land cruiser wagon 4wd" "toyota tacoma 4wd"
## [35] "gti"                    "jetta"
## [37] "new beetle"             "passat"
It works! There are 38 different types of cars in the dataset.
If you want to select rows rather than columns from the dataframe, use square brackets [], for example:
mpg[194,]
## # A tibble: 1 x 11
##   manufacturer   model displ  year   cyl    trans   drv   cty   hwy    fl
##          <chr>   <chr> <dbl> <int> <int>    <chr> <chr> <int> <int> <chr>
## 1       toyota corolla   1.8  1999     4 auto(l3)     f    24    30     r
## # ... with 1 more variables: class <chr>
If you want a particular entry in the dataframe, provide a column number as well:
mpg[194,2]
## # A tibble: 1 x 1
##     model
##     <chr>
## 1 corolla
And, of course, you can also look at a range of rows and columns as well:
mpg[194:198,1:4]
## # A tibble: 5 x 4
##   manufacturer   model displ  year
##          <chr>   <chr> <dbl> <int>
## 1       toyota corolla   1.8  1999
## 2       toyota corolla   1.8  1999
## 3       toyota corolla   1.8  1999
## 4       toyota corolla   1.8  2008
## 5       toyota corolla   1.8  2008
You should now be able to find your way around dataframes. If you are having trouble, you can always go over this section again until you are familiar with what to do.